Concussion (or mild traumatic brain injury) is the result of a blow to the head and is common in many secondary and collegiate sports. Typical symptoms include headache, vomiting, dizziness, and an inability to concentrate. These symptoms normally resolve themselves in a few days, although in some cases may last an extended period of time. Sports in which concussions are the most common are football, soccer, lacrosse, and ice hockey. And, if you are a running back or a linebacker in football, play goal keeper on a soccer team, or an attack position in lacrosse, your odds of suffering a concussion are higher than your teammates playing other positions.
In this unit we will review basic statistics about the incidence of concussion in high school and college sports, look at regional differences around the country, and finally make comparisons over time related to the size and athletic ability of potential NFL football players, thinking about the implications of differences in terms of the potential for concussion. A final question you will be asked to address is how results from a similar comparison bear on athletes at your school.
The mathematics involved in making these comparisons involves some basic statistics (mean, standard deviation, and confidence interval), frequency charts and standard normal (or bell) curves, and a basic statistical test for comparing groups of data - the t-test.
Let's start, though, with the short video below that provides some basic information about concussions:
The number of reported cases of concussion has increased significantly in the last two decades. This increase is in part due to greater awareness of the impact concussions can have on developing teenage brains. In part it is the result of greater participation in activities that can result in a concussion. It also is a result of more informed and better supervision on the part of school coaches and athletic trainers. The National High School RIO program at the University of Denver School of Public Health has collected injury data related to sports participation since 2005. The data comes from a national sample of secondary schools that have an athletic trainer on staff who provides an online record of their school's athletic activity and injuries. The concussion data in the graph below comes from the RIO study. The rates are reported in terms of "athletic exposures." These include all practices and competitions multiplied by the number of athletes participating. So the 9.6 per 10,000 AEs reported for male football players in the 2018 bar of the graph means that for every 10,000 player practices and games there were 9.6 reported concussion injuries. The graph allows you to examine data for football, soccer, basketball, and lacrosse for both males and females.
Concussion Rate per 10,000 Athletic Exposures
1) In the How Concussions Work video a variety of symptoms of concussion are discussed. Describe at least five of these.
2) Discuss the connection between returning to a sport too soon after a concussion and post concussion syndrome, or PCS.
3) According to the video what are the long and short terms effects of sub concussive blows to the head that you might experience by repeated heading the ball in soccer or blocking or tackling in football?
4) Use the graphs above and compare the incidence of concussion sport-to-sport and male-to-female. What are the three most significant observations from your comparison?
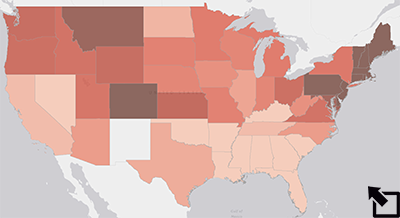
5) The map linked at the right contains data from the Centers for Disease Control and Prevention (CDC) related to the incidence of concussion among the high school age population as well as data from the National Federation of State High School Association (NFHS) related to the numbers of high school students participating in various sports. Open the map.
a) The map opens showing the rate of participation in boys' 11-player football across the country. Where are the rates the highest? lowest? Use the Change Style (  ) feature and examine the participation rates for the other sports both male and female. Notice in the football example that there are two variables added - the number playing football and the number of high school age boys. You will have to make a similar comparison to look at the participation rates for other sports. How do other sports compare with football?
b) Open the Concussion tab. Data is from the CDC and shows the rate of concussion among high school age individuals. Describe how the this map compares with the map showing the rate of football participation? participation in the other sports?
c) Look closely at the pop-up data for Nebraska and Maryland. Describe the differences.
Clifford Robbins, 2012 How Concussions Work, (TedEd, July 27, 2017). Downloaded December 10, 2017.
Concussion data from Dawn Comstock, et al, "High School Sports-Related Surveillance Study, (Denver: University of Denver School of Public Health, 2005 - 2018). Downloaded August 26, 2018
Participation data from 2017-18 HIGH SCHOOL ATHLETICS PARTICIPATION SURVEY,(Indianapolis:THE NATIONAL FEDERATION OF STATE HIGH SCHOOL ASSOCIATIONS, 2018>. Downloaded August 26, 2018
