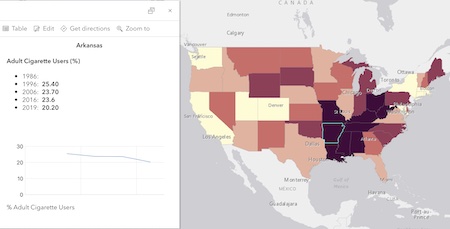
The map shows the adult use of cigarettes
beginning in 1986 and ending in 2019. You can select
to Change Style ( ![]() ) and switch the visible layer from year-to-year. Make note of the mean percentage each year.
) and switch the visible layer from year-to-year. Make note of the mean percentage each year.
1) Describe the changing pattern of cigarette use in the United States that you see as you study the maps from 1986 to 2019.
2) Examine
the data table (![]() ).
Click on the header in each column and you can sort the data.
Which states had the highest and the lowest percentage of
cigarette use in each year?
).
Click on the header in each column and you can sort the data.
Which states had the highest and the lowest percentage of
cigarette use in each year?
3) Filter
data (![]() )
to compare changes year to year. For example, identify the
states where the percentage of smokers in 2019 was greater
than the average value ( ) in 1986. in 1996. in 2006.
Describe your observations.
)
to compare changes year to year. For example, identify the
states where the percentage of smokers in 2019 was greater
than the average value ( ) in 1986. in 1996. in 2006.
Describe your observations.
Smoking data from """Current Cigarette Smoking Prevalence (%) Among Adults by Stat"," (Atlanta: Centers for Disease Control and Prevention, 2009. Behavioral Risk Factor Surveillance System, 1984-2009), (American Lung Association, July, 2011).
and from Current Cigarette Smoking Prevalence (%) Among Adults, 2016, (Atlanta: Centers for Disease Control and Prevention, 2016.), downloaded October 10, 2017.
